View analysis & feed
Once your deliveries are uploaded and reviewed, you can open the session in the app to watch each delivery with on-video analysis, read your session KPIs, share to the feed, and manage your profile.
Your sessions
Section titled “Your sessions”Open the Sessions tab to see your recorded sessions, listed by date. Tap a session to open it. Each session has two tabs:
- Gallery — every detected delivery as its own clip.
- Report — the KPIs for the whole session (see Session report).
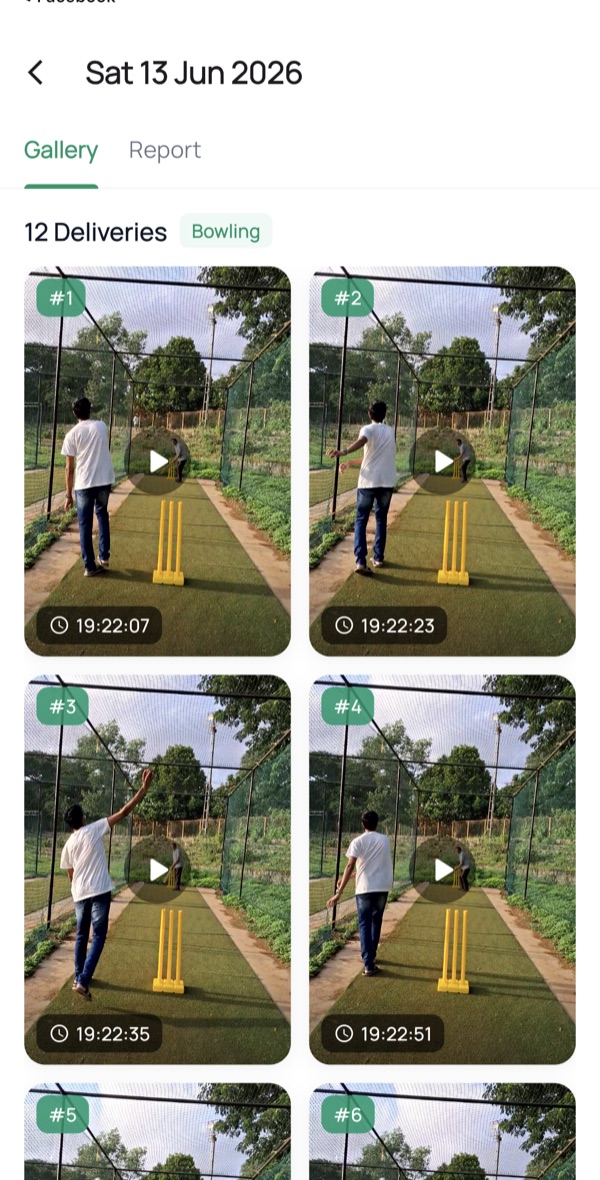
The Gallery header shows the number of deliveries and whether the session was tagged Batting or Bowling. Each clip is numbered (#1, #2, …) with the time it was bowled. Tap any clip to open the delivery analysis.
Analyse a delivery
Section titled “Analyse a delivery”Tapping a delivery opens the analysis player. The clip plays with analysis drawn straight onto the video, and the buttons down the right-hand side switch between analysis layers. The header shows which delivery you’re on (for example, Delivery 1 · 1/12).
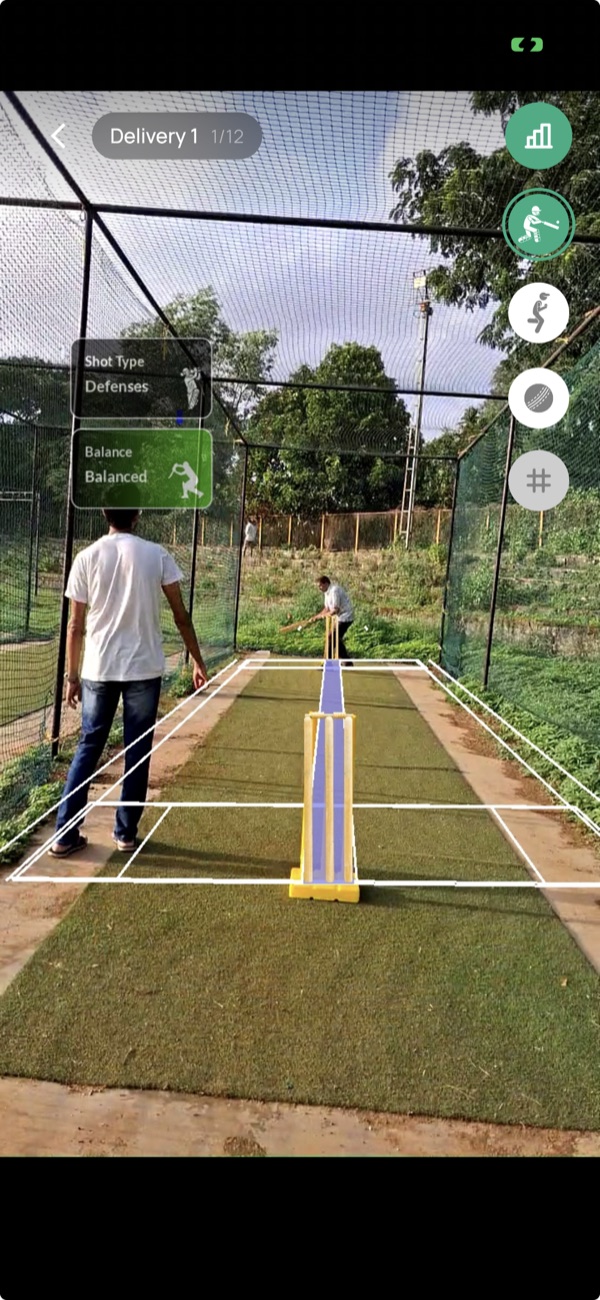
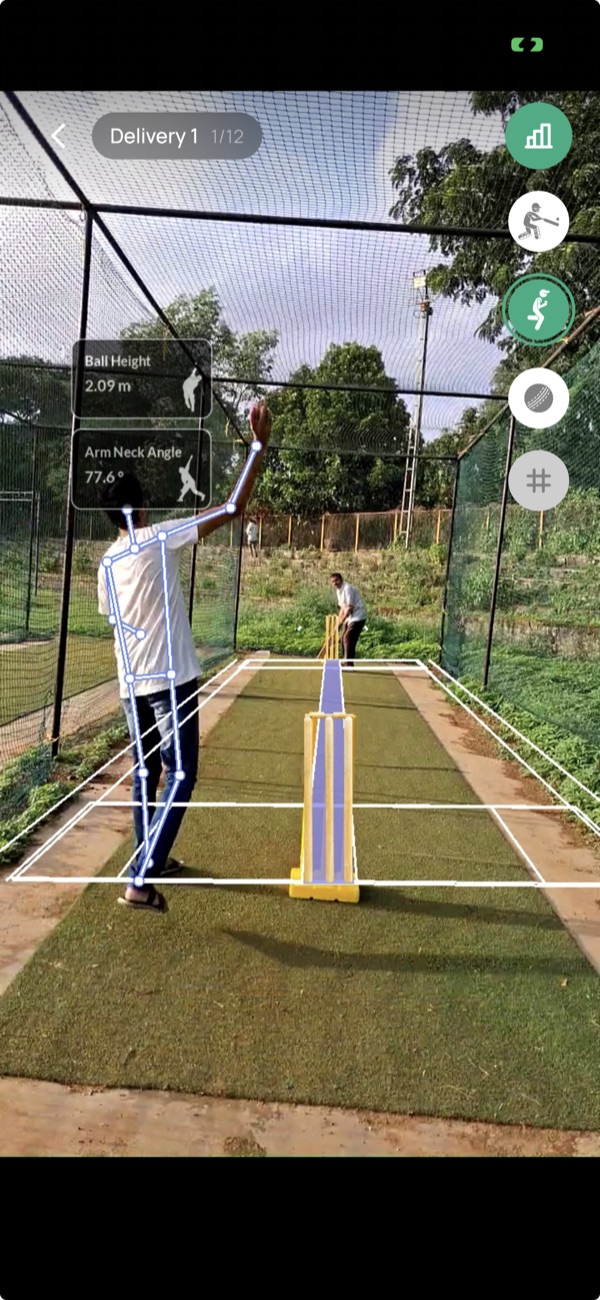
Use the buttons on the right to toggle each layer on or off — the batting, bowling, and ball-tracking overlays above, plus a stats view for the delivery and a pitch-zone grid. Swipe to move between deliveries in the session.
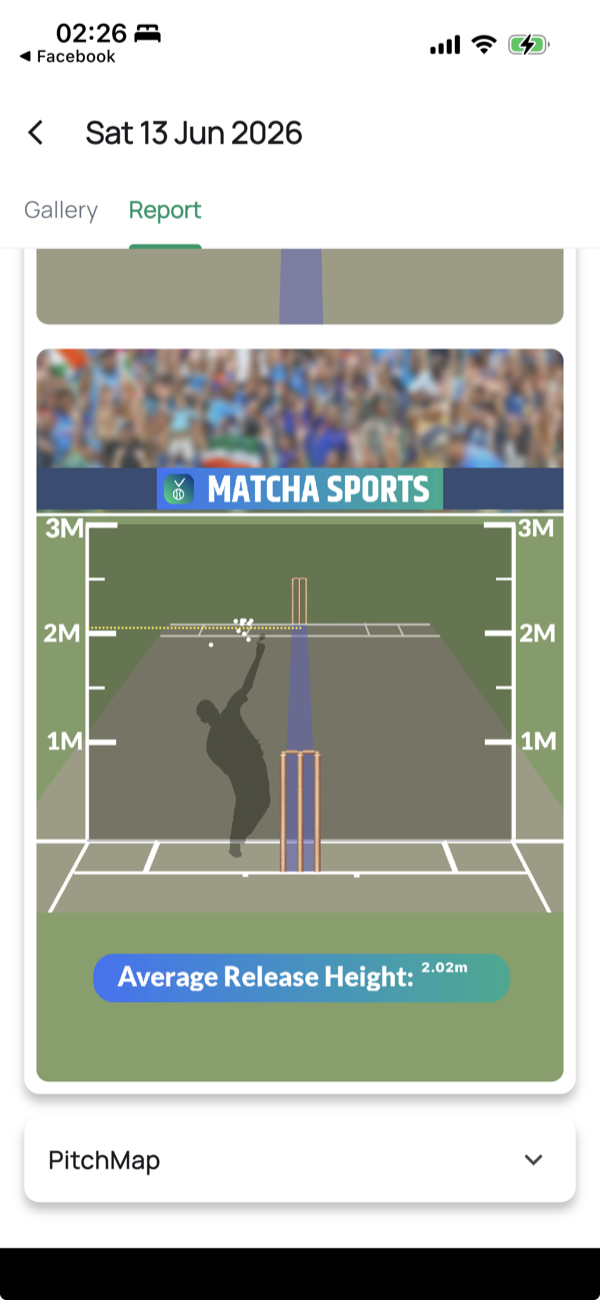
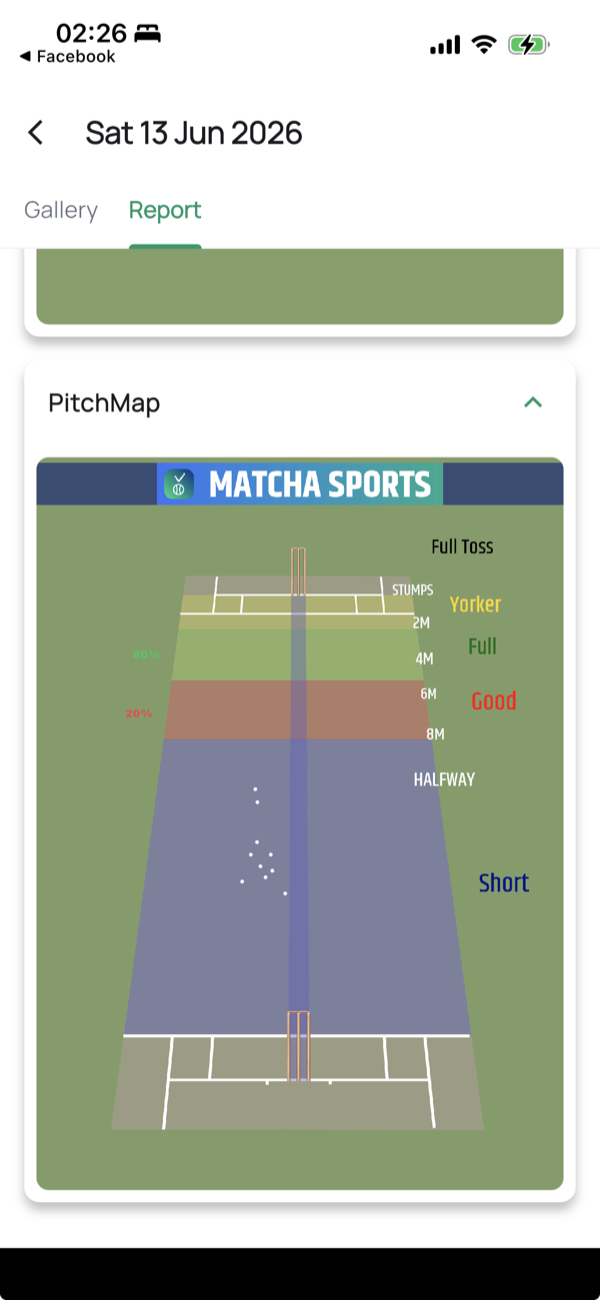
Session report
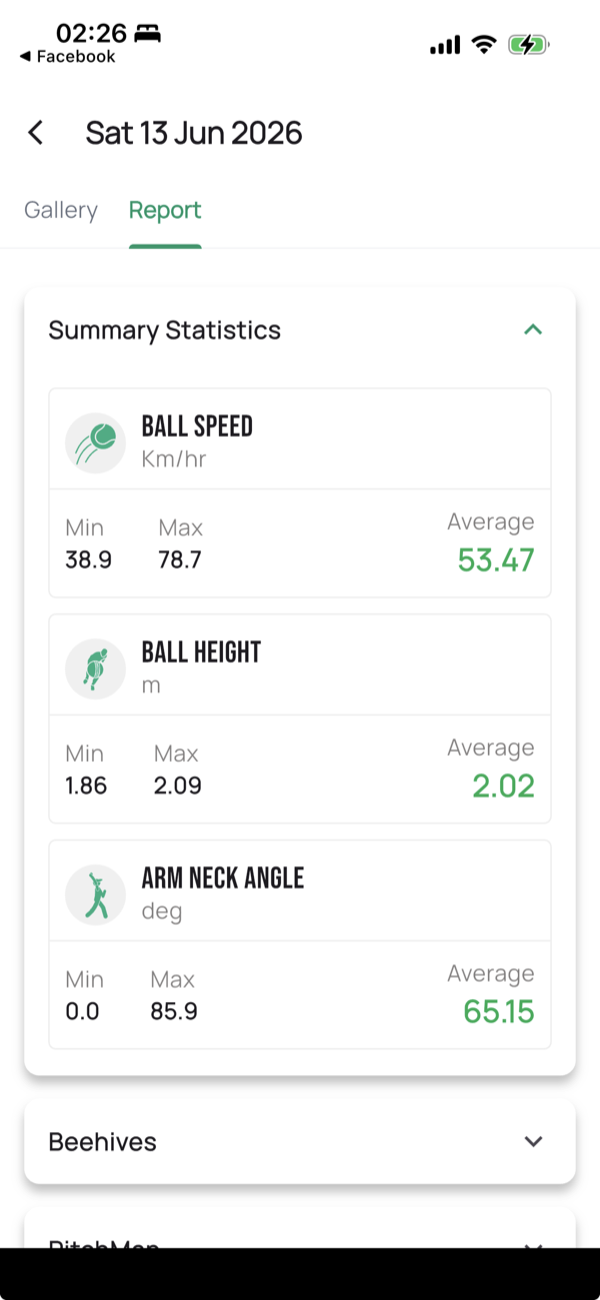
Section titled “Session report”The Report tab summarises the whole session, not just one ball. It opens on Summary Statistics and expands into visual breakdowns.
The feed & network
Section titled “The feed & network”- The Home tab is a social feed — posts, comments, and likes.
- The Network tab lets you find and follow other players and coaches.
- You can create your own posts to share clips and updates.
Your profile
Section titled “Your profile”Your profile shows your details and cricketing activity. You can edit your profile information from the profile/settings area.
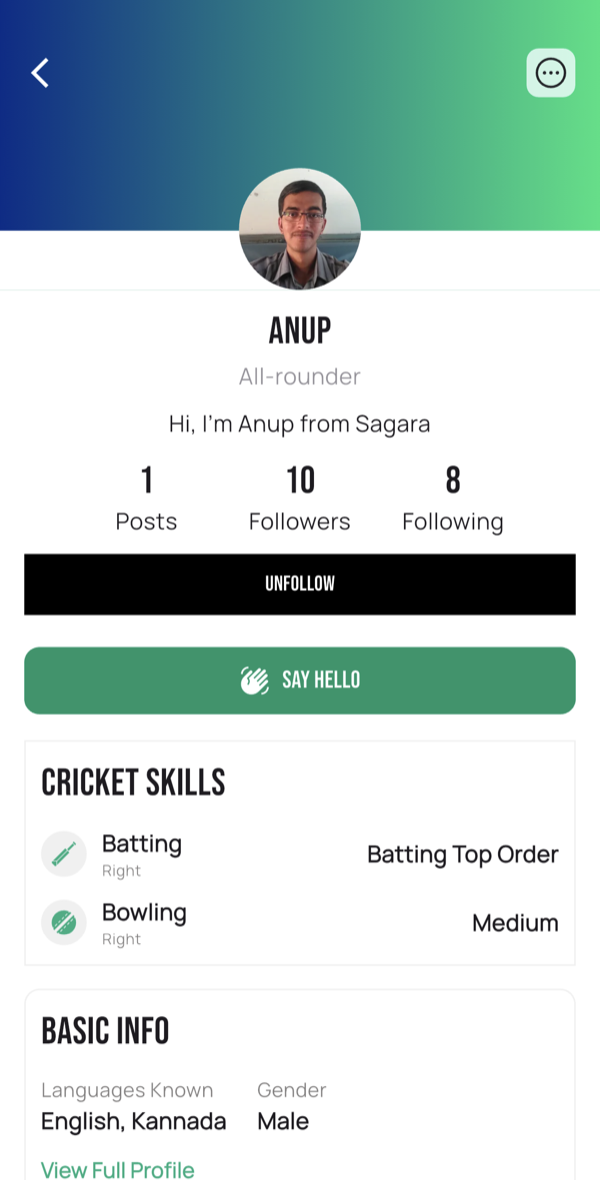
A profile includes:
- Posts, Followers and Following counts, with Follow / Unfollow and Say Hello actions when you view someone else.
- Cricket Skills — batting and bowling style (for example, Batting: Right, Top Order and Bowling: Right, Medium).
- Basic Info — such as languages known and gender. Tap View Full Profile for the complete details.