Review KPIs & annotate clips
Once a club session is recorded and tagged, every tagged player gets their own report. You can read their KPIs and draw on a clip frame to make a coaching point.
Open a player’s report
Section titled “Open a player’s report”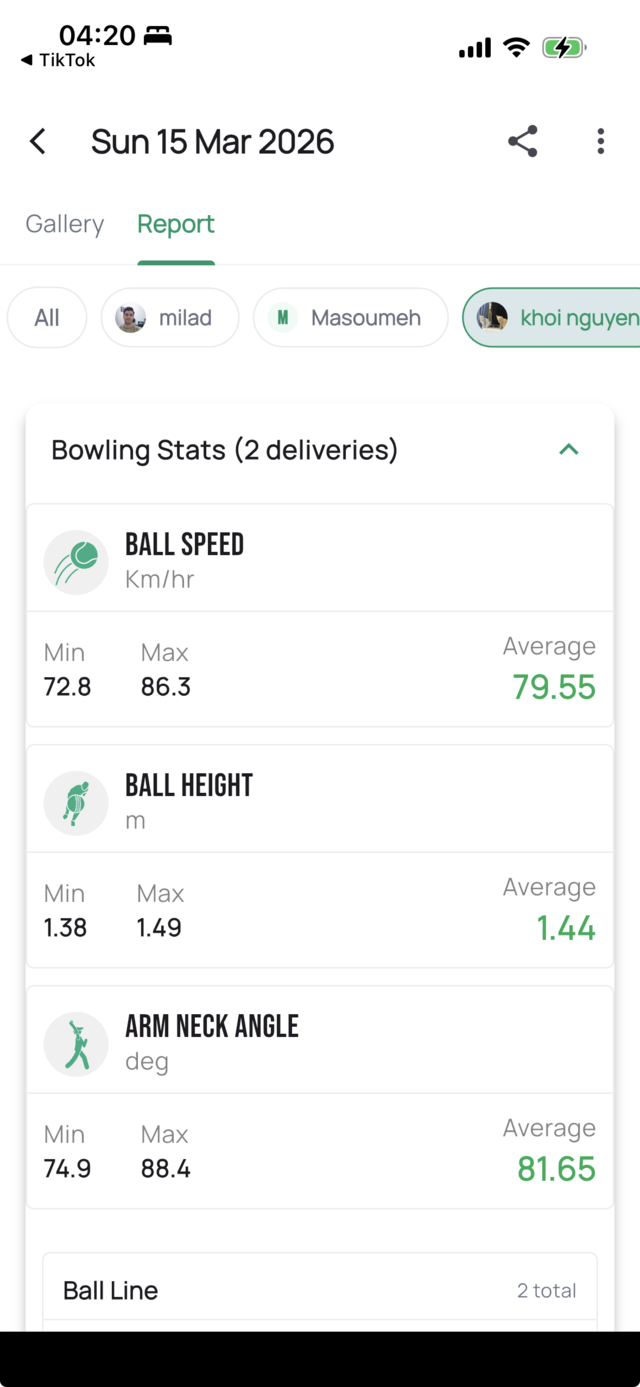
In Session Info, open the Report tab and pick a player. Each tagged player has their own report.
What the KPIs mean
Section titled “What the KPIs mean”Numeric KPIs (shown as min / max / average):
- Ball Speed (km/hr)
- Ball Height (m)
- Arm-Neck Angle (deg)
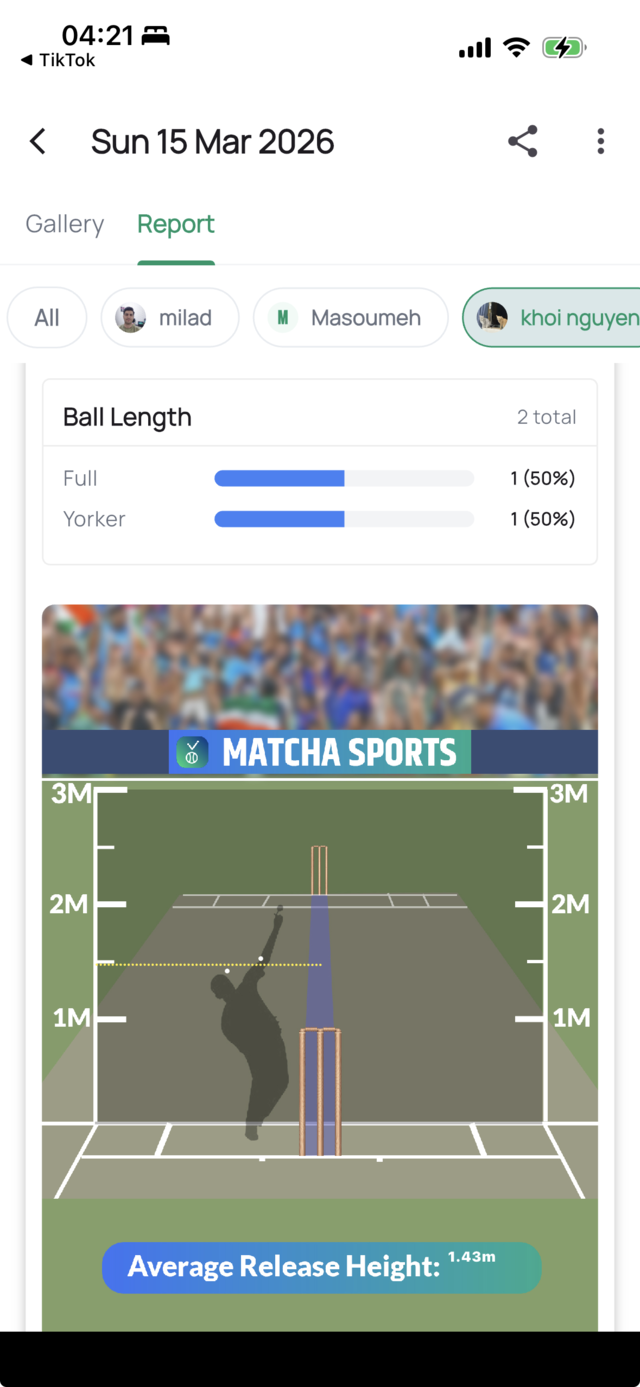
Categorical KPIs:
- Ball Line
- Ball Length
- Shot Type
- Batsman Balance
Visualizations:
- Bowling beehive
- Pitch map
- Batting beehive
Annotate a clip (draw on the image)
Section titled “Annotate a clip (draw on the image)”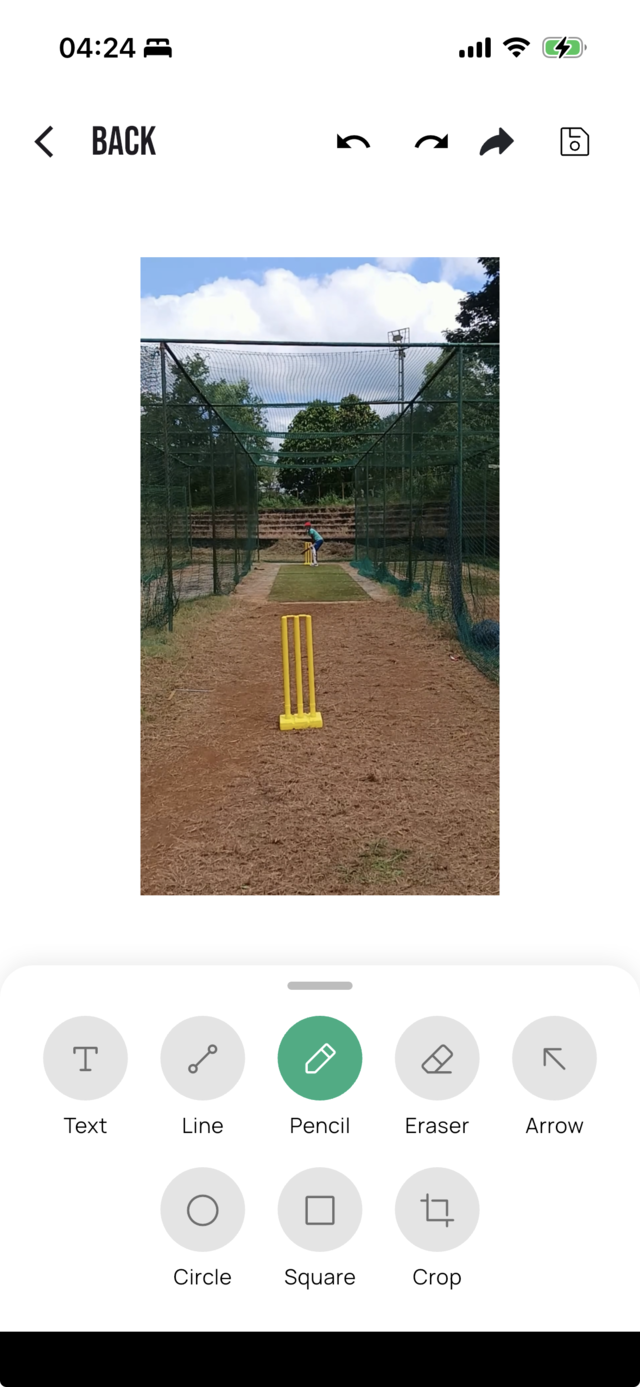
- Open a clip.
- Tap Screenshot to capture the current frame.
- Draw on the frame with the tools: Text, Line, Pencil, Eraser, Arrow, Circle, Square, plus Crop.
- Save the annotated image to your gallery, or share it (via the share sheet) with your player.
Next: schedule the next club session, or see how players view their analysis & feed.